IBM Integration Bus: Stats and Accounting
Message flow stats and accounting can be used to analyze the performance of the message flows and their usage. It records the dynamic information and behavior of the message flows. The recorded details can be viewed in the web user interface respective to each integration server and also configure integration servers to send the data to IBM Cloud Log Analysis.
How can you collect data?
Following points must be considered when you plan to collect data:
-
Collection option
-
Accounting origin
-
Output formats
There are two types of data that can be collected: snapshot/short data and archive/long data.
Accounting origin: To make use of this, we must perform the following tasks-:Activate data collection – use mqsichangeflowstats command
- Configure message flow – You can set different values for every message flow or for a group of message flows for which data collection is active. In ESQL node you must set a value in the field With correlation name Environment.Broker.Accounting.Origin. The value must be character data and can be a maximum of 32 bytes.
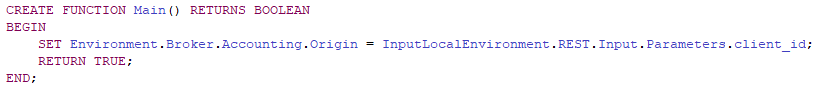
Figure: Set a value to a message flow in ESQL node
Output formats: When you collect the message flow statistics choose the destination for data or the default will be set as user trace. This can be done using mqsichangeflowstats command and the destination can be any of the following:
-
User trace
-
JSON publication
-
XMLL publication
-
SMF records
-
CSV records
-
IBM Cloud Log Analysis events
Data to be collected
You can request two types of data to be collected – web user interface and view snapshot data or use command line instruction mqsichangeflowstats to collect snapshot and archive data.
Collection options:
-
Snapshot data is collected for an interval of approximately 20 seconds. The length of the interval cannot be modified, the interval time depends on the system loading and integration node activity. At last of the interval time, the recorded statics are written to the output destination and the interval is restarted.
-
Archive data is collected for an interval that is configurable in the range of 1 to 43200 minutes.
An interval ends and restarts when any of the following events occur, to preserve the integrity of the data that has been collected prior to the event:
-
The message flow is redeployed
-
The set of statistics data to be collected is modified
-
The integration node is shut down
On z/OS®, you can set the command parameter to 0, which means that the interval is controlled by an external timer mechanism. This support is provided by the Event Notification Facility (ENF), which you can use instead of the integration node command parameter if you want to coordinate the expiration of this timer with other system events.
You can collect snapshot data and archive data at the same time. Even though the data collected in both is the same, the interval is different and one must be careful not to combine information from the two different reports. You can view statistics data as it is generated by selecting the Statistics tab in the web user interface.
Moreover, you can control what level of data depending on the requirements:
-
Integration Servers: Data from single or multiple integration servers.
-
Message Flows: Data from single or multiple messages flows.
-
Nodes: Choose whether to exclude data related to nodes or include basic data or advanced data.
-
Threads: Data related to threads.
Monitoring Alert
The threshold can be set to alert monitoring automatically if it exceeds the threshold with the help of monitoring tools such as ITCAM and IBM Tivoli OMEGAMON XE for Messaging for z/OS.
Using stats and accounting data alerts can be set if:
-
Message flows exceed a given CPU
-
exceeds elapsed time expectation
-
non-zero processing error
-
MQ error
-
Back-out count
Similarly, node level data alerts can be set if:
-
Time exceeds to respond when 3rd party service used
-
Failure terminal detects message flow failure
Products such as IBM Operations Analytics – Predictive Insights look to identify relationships between accounting and statistics metrics and anticipated bounds based on historical monitoring. Here alerts can be made with the help of relationships learned from historical data. You don’t need to set thresholds manually for alerts. The latest feature in IBM Integration Bus 10.0.0.5 is the introduction of new C plugin API. The new C plugin API allows developers to write C plugins that can access the statistics data directly. This provides an alternative route to capturing the XML or JSON publications from MQ or MQTT and transforming those publications into the correct format before sending them on to another application for storage or visualization.
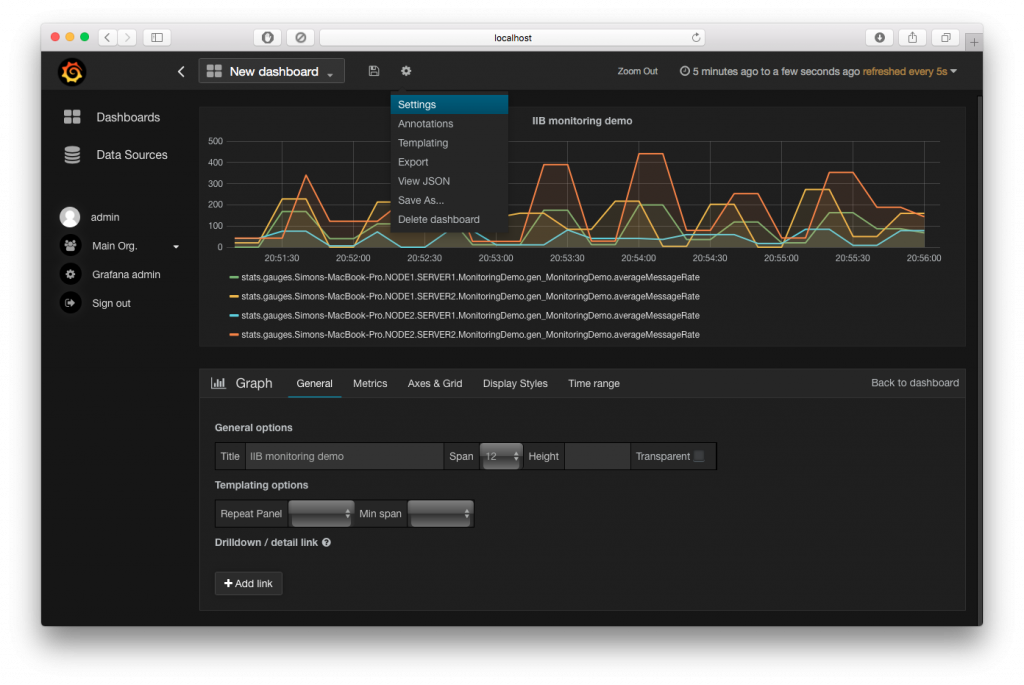
Figure: Visualization of integration bus statics data using Grafana
For more information https://developer.ibm.com/integration/blog/2016/08/18/visualizing-ibm-integration-bus-statistics-data-using-grafana/
Identify problems
We can use the statistics generated for the following purposes:
-
We can use snapshot data to assess the execution of a message flow to determine why it, or a node within it, is not performing as you expect.
-
We can determine the route that messages are taking through a message flow. For example, you might find that an error path is taken more frequently than you expect and you can use the statistics to understand when the messages are routed to this error path.
Check the information provided by snapshot data for routing information; if this is insufficient for your needs, use archive data.
-
We can record the load that applications, trading partners, or other users put on the integration node. This allows you to record the relative use that different users make of the integration node, and perhaps to charge them accordingly. For example, you could levy a nominal charge on every message that is processed by an integration node, or by a specific message flow.
Before you start data collection, ensure that the publication of events has been enabled and that the pub/sub-broker has been configured.
You can start and stop data collection by using the mqsichangeflowstats command or the web user interface; you do not need to modify the integration node or the message flow, or redeploy the message flow, to request statistics collection.
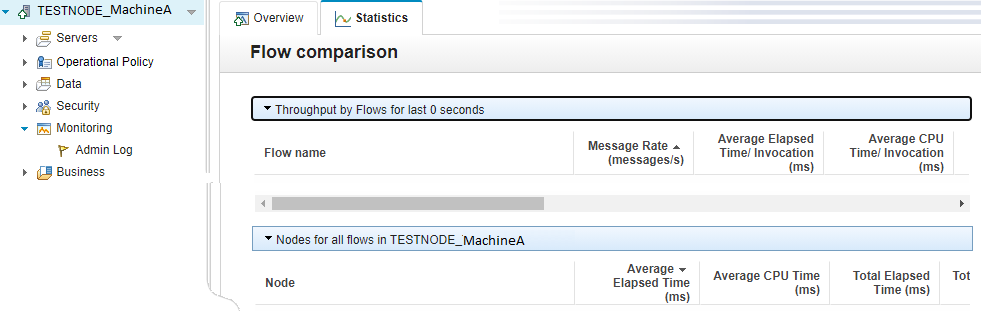
We can use the following steps to identify the factors that might be limiting the speed of a message flow, and to find out how you can increase the overall performance:- Use the web user interface to display the statistics for your message flow. You can use the information in the Flow analysis view to assess the performance of your message flows. Use the charts in the Flow analysis view to show data for any three statistics at a time; by default, the charts show the message rate, average elapsed time, and average CPU time for the nodes in the selected message flow:
Figure: Open WebUI for particular Integration Node in IIB V10
-
Use the Message rate chart to check the period of time during which the message rate has been low.
-
Use the Average elapsed time chart with the Message rate chart to check whether there is a correlation between the two statistics for this flow. If there is an increase in Average elapsed time and a reduction in Message rate, check the Total input messages to see whether messages have been entering the message flow. An increase in Average elapsed time might indicate that there is a bottleneck in message processing that might be caused by waiting for an external resource, such as a database. Check the data in the Latest data per node table to identify nodes with high elapsed times.
-
Use the Average CPU time chart to see whether the CPU time has increased or decreased in correlation with the Message rate. If the CPU time increases and the message rate decreases, it might indicate that there is a problem with the throughput of the message flow. For example, check the size of the messages that are being processed to see if it has increased in line with the drop-in rate. If the CPU has recently increased, check the commit counts, errors, and backouts.
To start, stop, or check the status of resource statistics collection, use one or more of the following options:
-
The IBM Integration Explorer
-
The mqsichangeresourcestats and mqsireportresourcestats commands
-
A CMP application – IBM® Integration API (CMP) Java™
Considerations
There are factors that should be considered when configuring the collection options with the level of data in terms of message flow, integration servers, node, thread. The timers used to record data must be selective based on requirements. There are two classes of timers internal and external. The collection options that are archived and snapshot timers fall under internal timers. The external timer is available in Z/OS namely ENF37. This can be used to drive SMF, UserTrace, and PubSub intervals.
You should also consider the data formats, size, and destinations. The IBM Tivoli OMEGAMON XE for Messaging for z/OS documentation also provides details of historical table record sizes that are used to warehouse the accounting and statistical data as well as resource statistics data.
Considerations of data can be based on the number of message flows, nodes, threads along with the data collection interval. The data compression/aggregation should be used to reduce the amount of data collected or consider increasing the collection interval.
Charge-Back modeling
With the help of stats and accounting data, you can record the load that particular user/users/partners or applications puts on the system. This helps to identify the use of resources for each user and charge them accordingly.
Conclusion
IBM integration Bus performance can be monitored to record it both for short and long intervals. The performance of the system can be analyzed based on various factors and it can be used in a number of different cases like problem determination and capacity planning.
With the help of stats and accounting strategy the history monitoring can be enabled in production and implement a charge-back model based on CPU usage, the number of times message flow used, etc.The WebUI in IBM Integration Bus v10 can be used to view snapshot data across all and individual message flows in an integration server this helps in identifying hotspots or bottlenecks and thus in problem determination without the need of collection archive data. Dynamic snapshot data collection in production helps to determine low-level problems and performance optimization.
We can help!

Convert Html To Text With Npoi
#Applicationre-engineering

Mvvm In Windows Presentation Foundation
#Applicationre-engineering

Reverse Geocoding Using Google Geocoding Api & .net
#Applicationre-engineering