The Growing Significance of Data Visualization in the Digital Age
Data Visualization is the process of displaying information in a visual format (such as illustrations, charts, graphs, tables, diagrams etc.) to understand the context more easily, and effectively communicate the underlying meaning.
It’s said that “a picture is worth a thousand words.” By nature, people have a tendency to easily grasp, process and remember visual form of communications than verbal or textual forms. Hence many organizations use this techniques for the effective usage and presentation of data. It’s simpler to discover examples, define processes, and settle on choices with visual data.
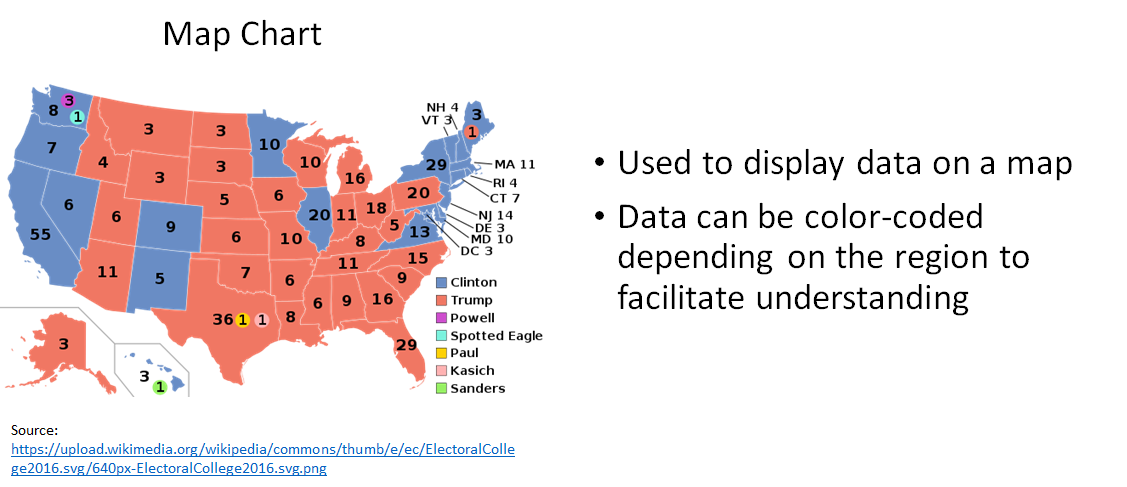
Data visualization can be utilized to find hidden actualities and patterns. For instance, line graphs are used to indicate progression, while bar and section outlines are valuable for representing connections and making correlations. Pie diagrams are an extraordinary method to indicate parts of an entirety. What’s more, maps are the most ideal approach to visually share any geographical data.
Key Advantages of Data Visualization
-
Help you decide what all products you need to place at a particular location
-
Can predict the sales, outline the trends and support decision making
-
Using advanced interactive data visualization software, you can understand the factors that influence customer behavior
-
Identify areas that need attention or improvement
-
Bring out the correlations and key details from the data that often goes unnoticed
-
Allow data engineers or scientists to track their data sources and make detailed analysis reports
Nowadays, data visualization is all about creating representational elements that allow the viewer to interact with the data and dive deeper into the data, without losing the core objective.
Identifying the Right Data Visualization Technique
The best approach to selecting the perfect design technique lies in understanding and defining your requirements properly.
-
Ask yourself these questions:
-
Who is your specific target(s)?
-
What your audience expects?
-
Which channels can take you to them?
-
What results do you anticipate?
Regardless of whether you’re a presentation maker, a development characterization genius, or a marvelous designer, as long as you fittingly check these considerations, you can easily choose the perfect visualization technique.
Different Data Visualization Techniques
Following are the top 10 Data Visualization techniques:
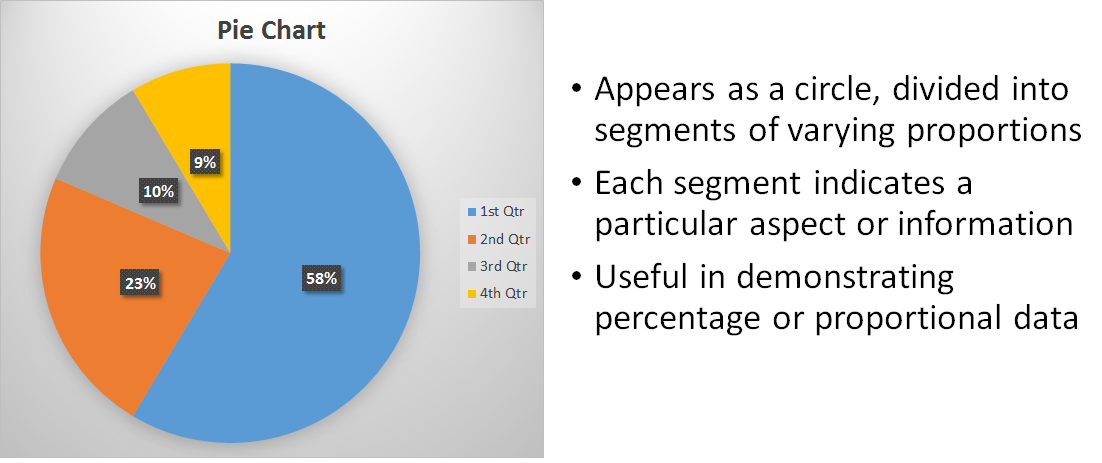
Pie Chart
Line Chart
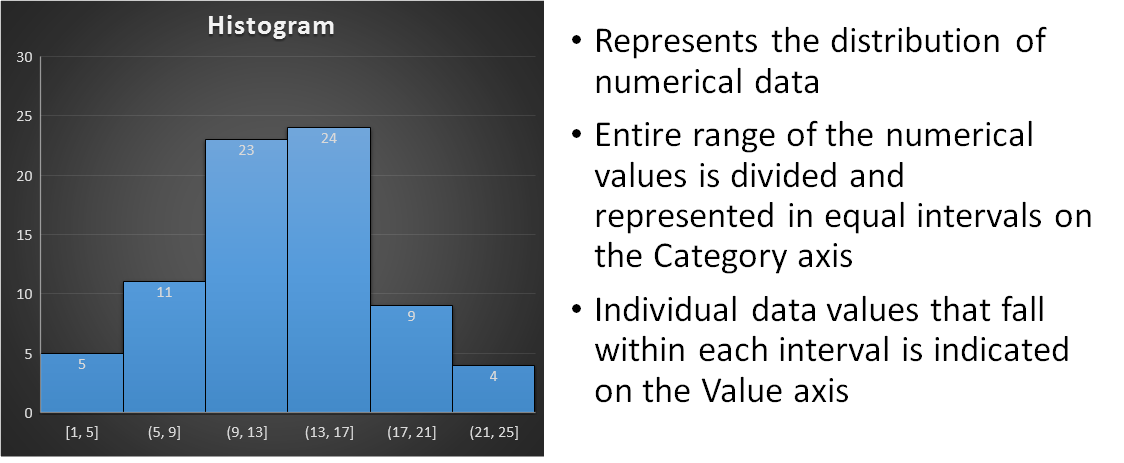
Histogram
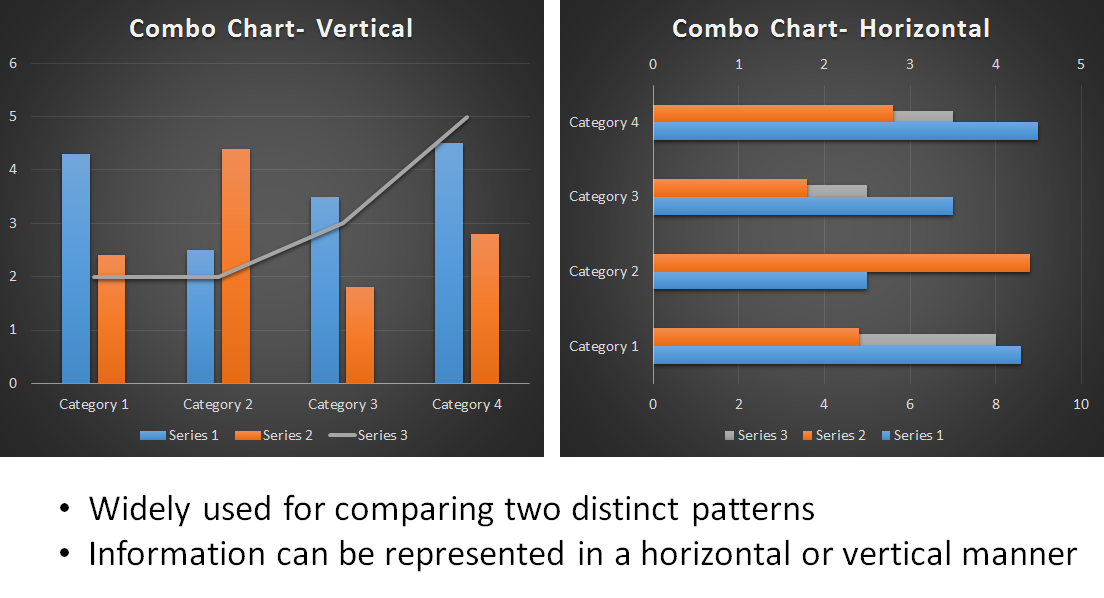
Combo Chart
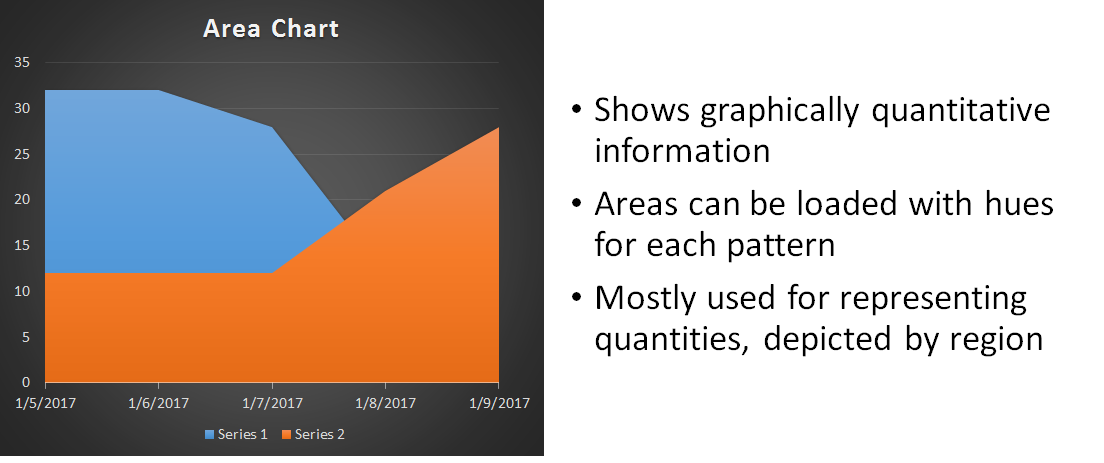
Area Chart
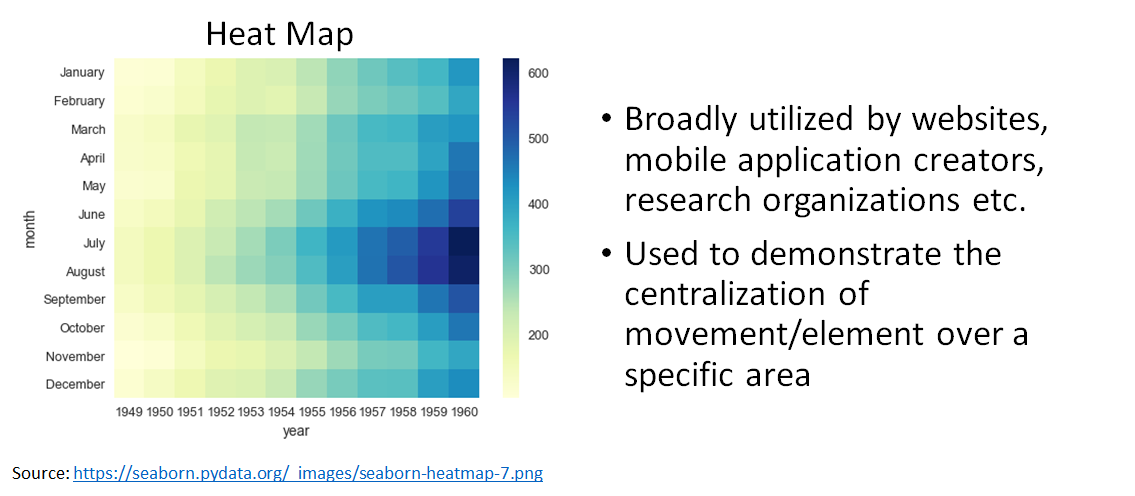
Heat Map
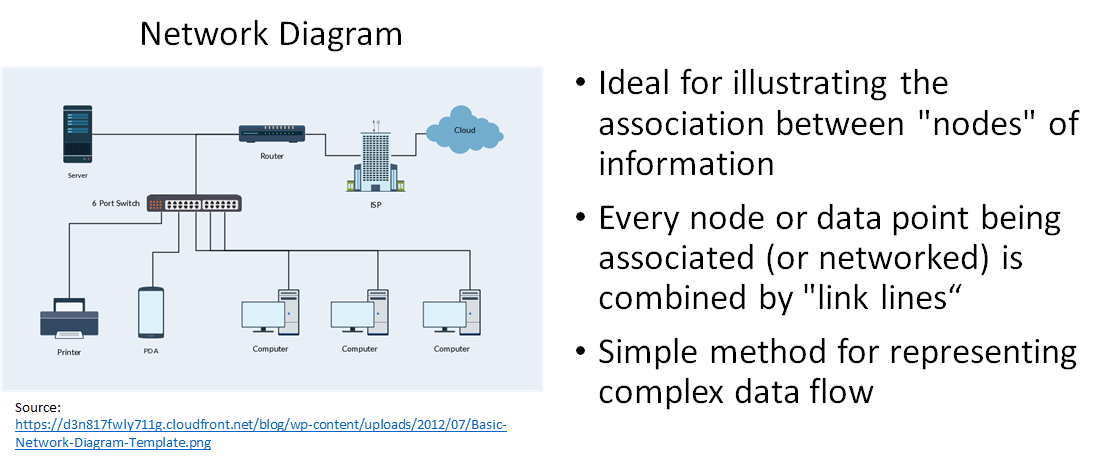
Network Diagram
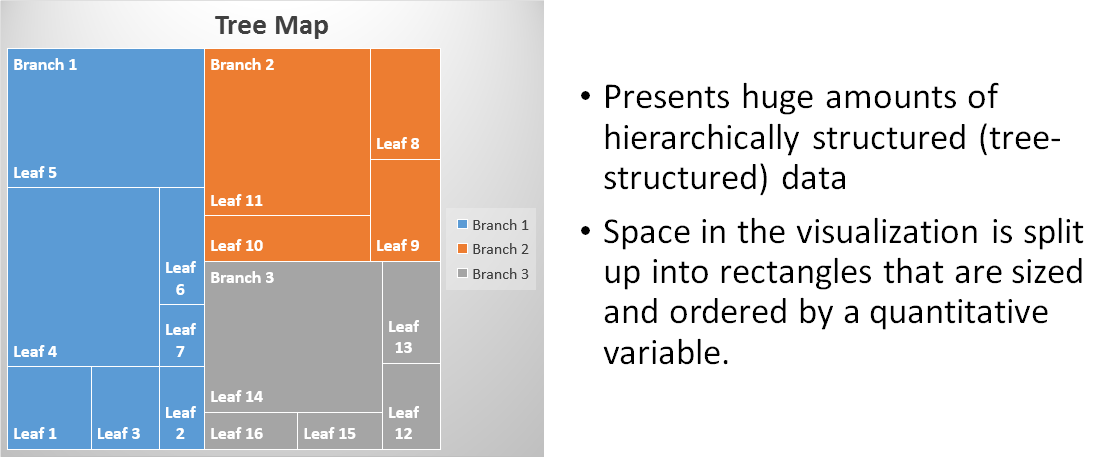
Tree Map
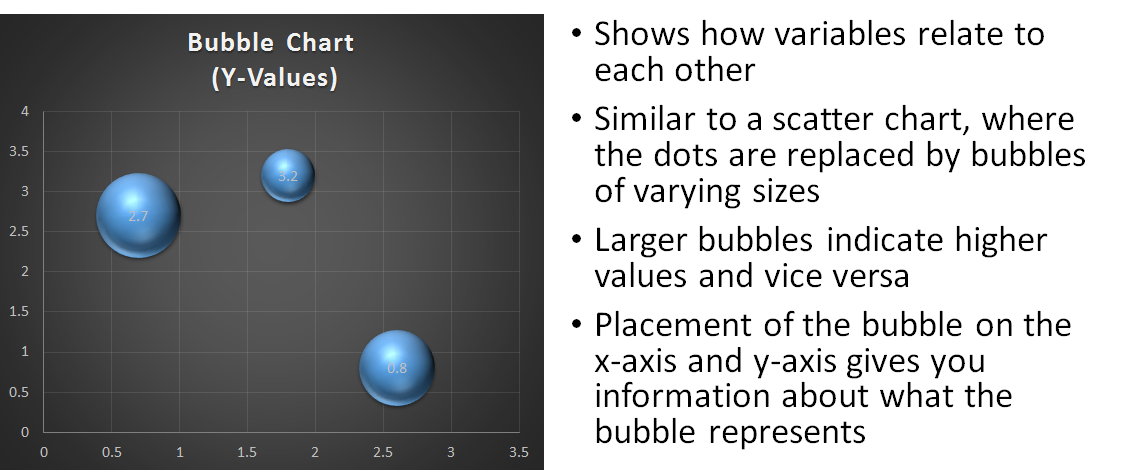
Bubble Chart
Map Chart
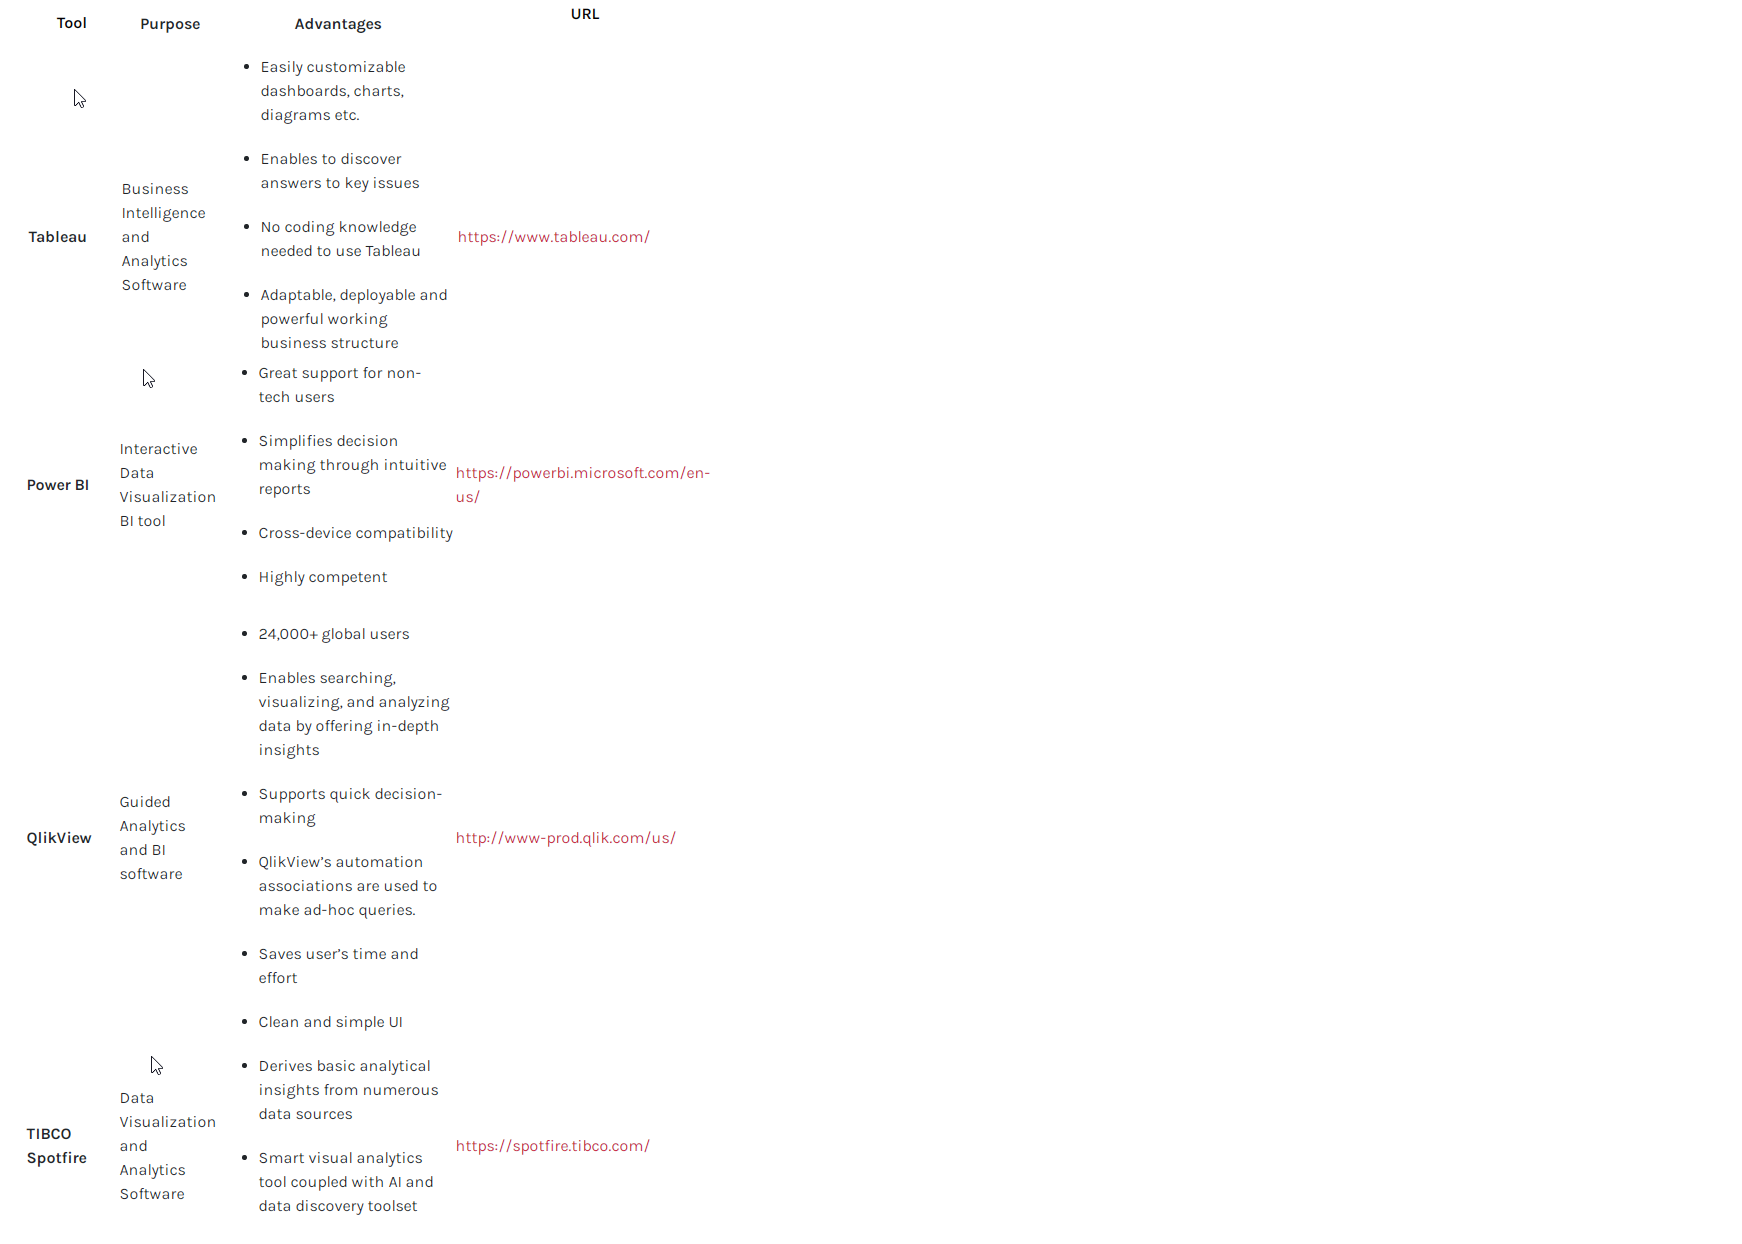
Four Leading Data Visualization Tools
Meet the four leading Data Visualization tools available in the market:
Today, these techniques are embraced more than before. The necessity to convert the essential load of data into comprehensible format is a major challenge for many organizations, and hence data visualization is gaining more traction. People, by and large, are visual learners since our brains are programmed for visualization.
Maryanne Wolf, in her book, Proust and the Squid: The Story and Science of the Reading Brain states that “We were never born to read. Thanks to this design, we come into the world preprogrammed with the capacity to change what is given to us by nature, so that we can go beyond it. We are, it would seem from the start, genetically poised for breakthroughs.”
True to Wolf’s findings, data visualization has a significant place in an organization’s growth.
To know more about bespoke digital technologies to transform your enterprise radically, talk to an expert today.
We can help!

Why Your Business Needs Cognitive Computing
#Dataanalytics

Scalable Support Request Analysis Using Embeddings, Hdbscan, And Tiny Llms
#Applicationre-engineering

Why Many Call Centers Are Rethinking How They Handle Customer Calls
#Artificialintelligence